flamegraph 
- Description
- Flame graphs for Emacs's native profiler and folded stacks files
- Latest
- flamegraph-0.2.tar (.sig), 2026-Jun-04, 70.0 KiB
- Maintainer
- Dmitry Gutov <dmitry@gutov.dev>
- Website
- https://github.com/dgutov/emacs-flamegraph/
- Browse ELPA's repository
- CGit or Gitweb
- Badge

To install this package from Emacs, use package-install or list-packages.
Full description
flamegraph.el
![]()
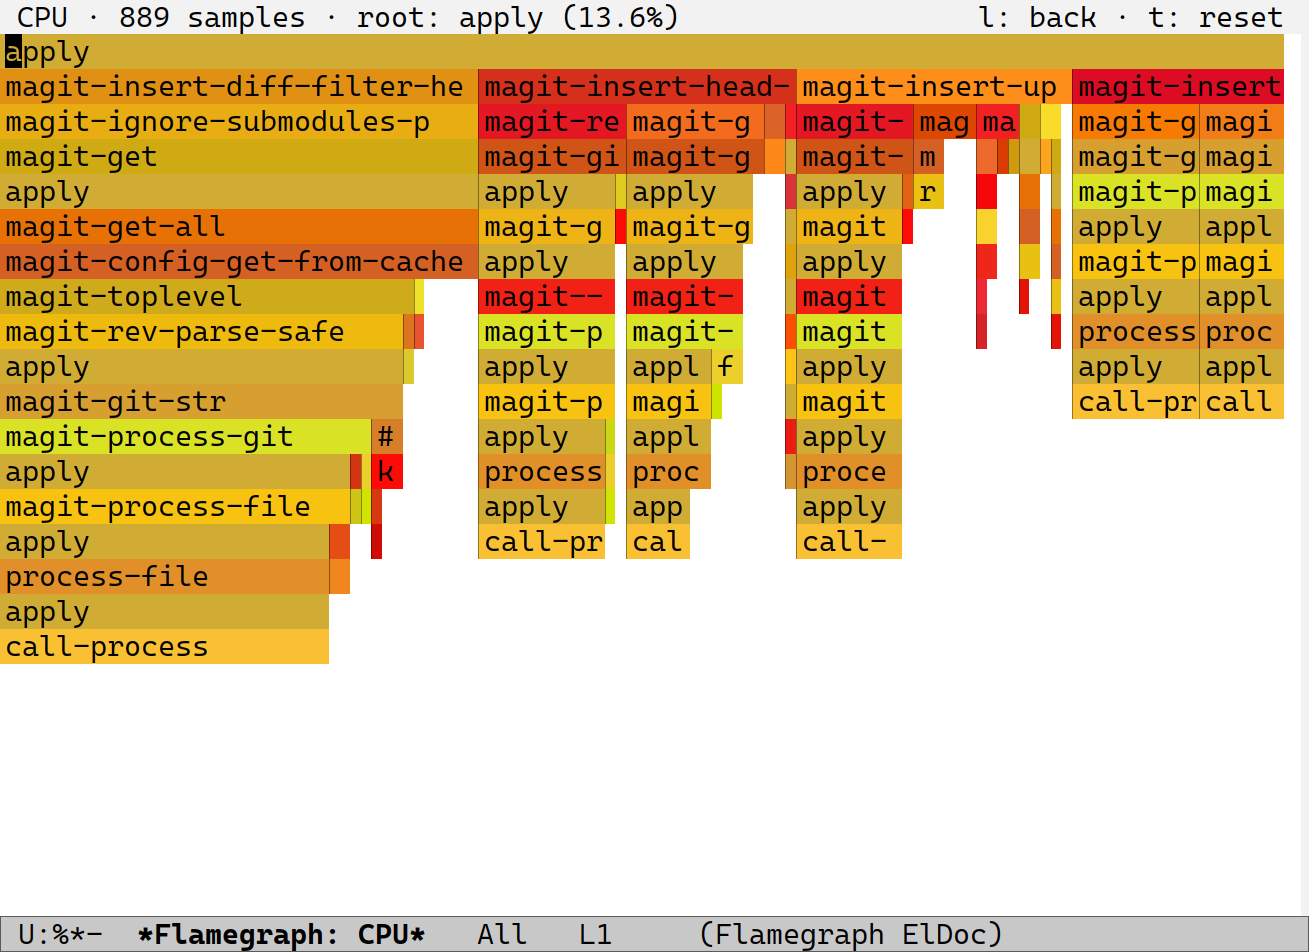
Flame graphs for the Emacs profiler, and for folded-stacks
files produced by perf, py-spy, rbspy, etc.
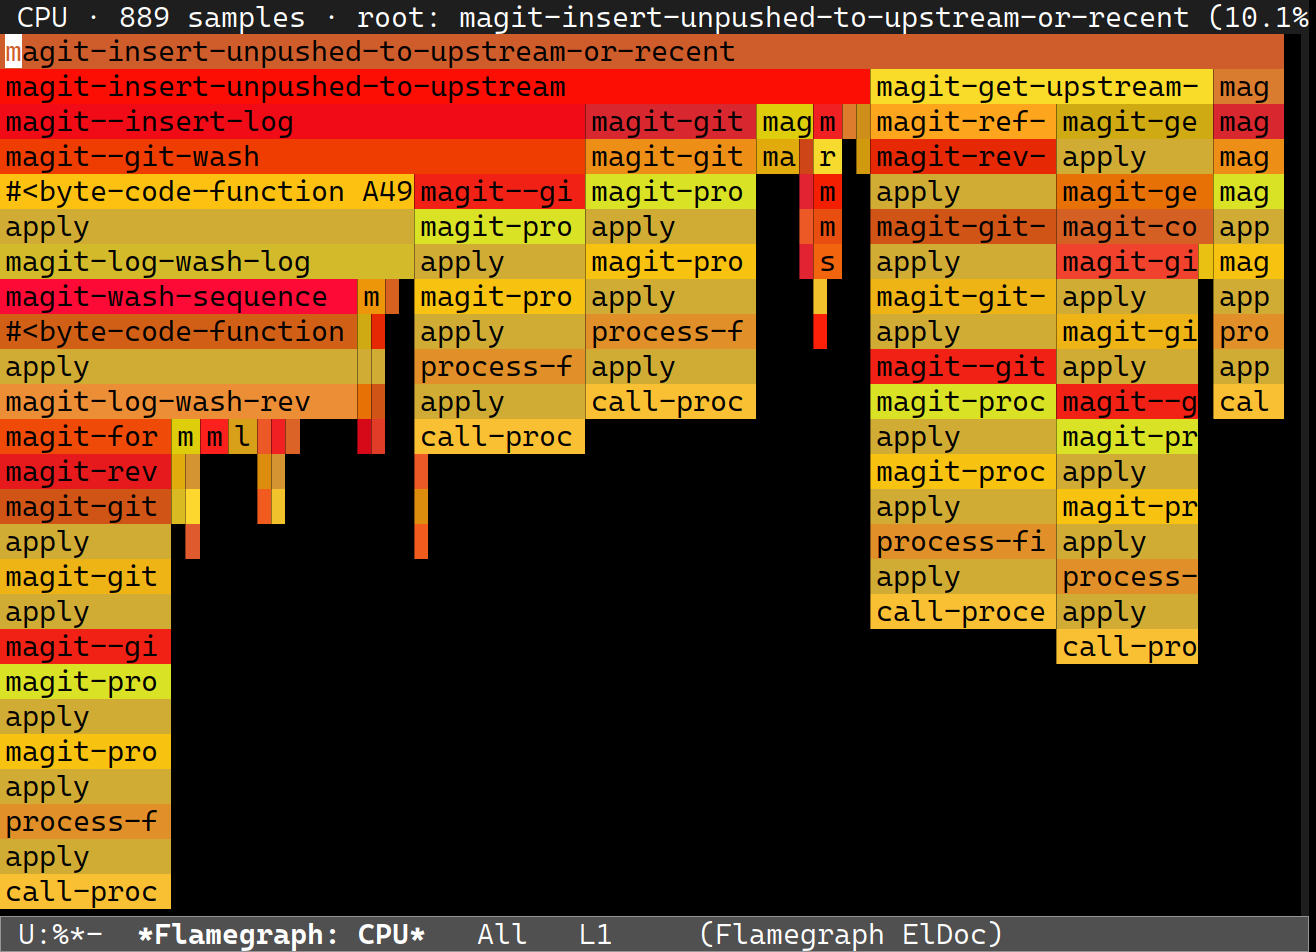
Rendered into an interactive buffer using display specs (an SVG renderer is planned). Top-down "icicle" orientation: the outermost frame sits on the top row, and the stack grows downward. Identical call paths are merged and children are sorted heaviest-first.
RET / mouse-1 zooms into a frame; d opens a description (parent,
callees, self-time) with a source code snippet; f opens that source.
The snippet and f need a source location: Elisp profiler frames can be
resolved through their definitions; for perf, fold with -F +srcline
(see Recording below).
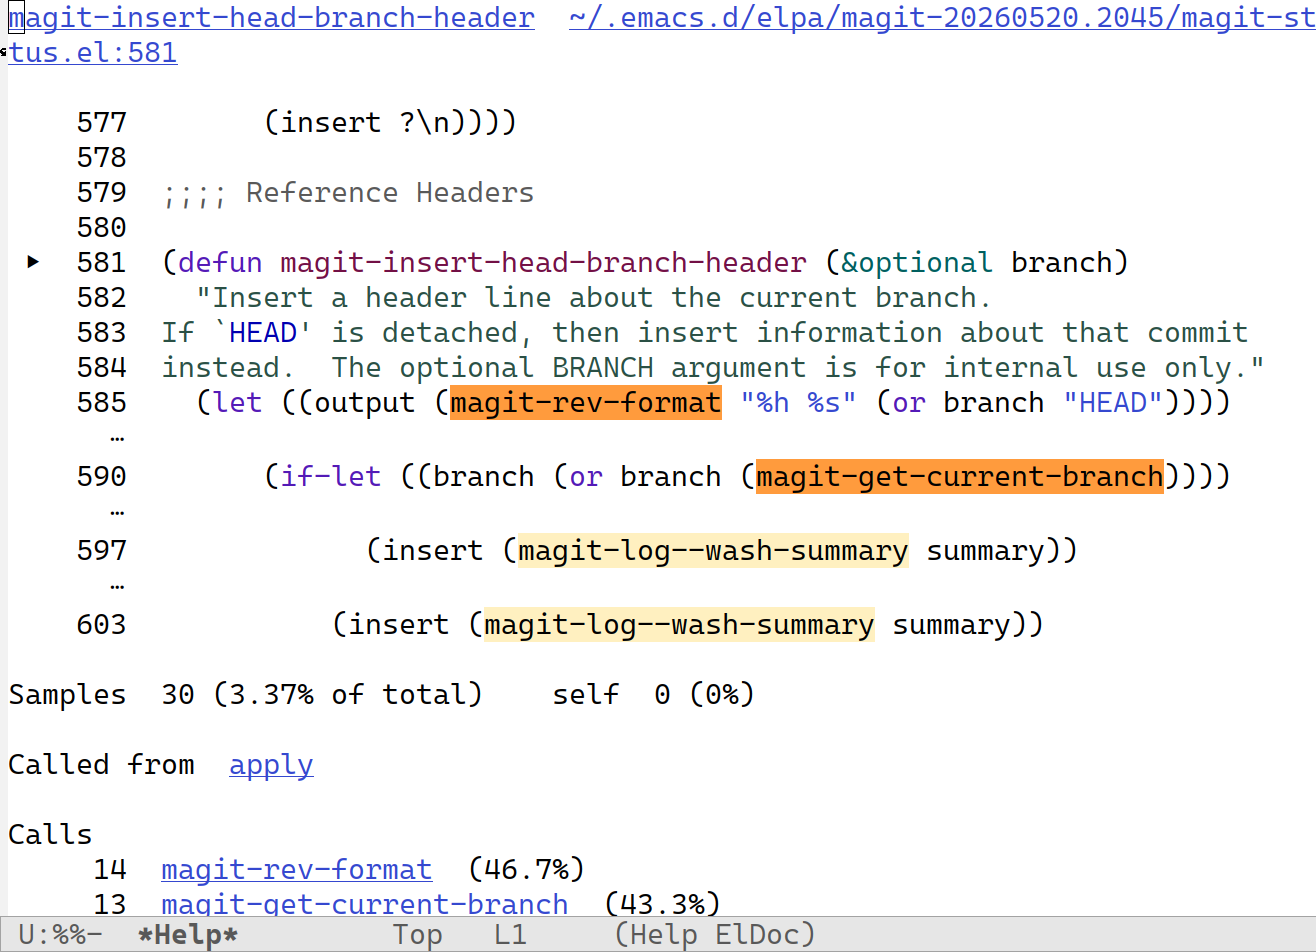
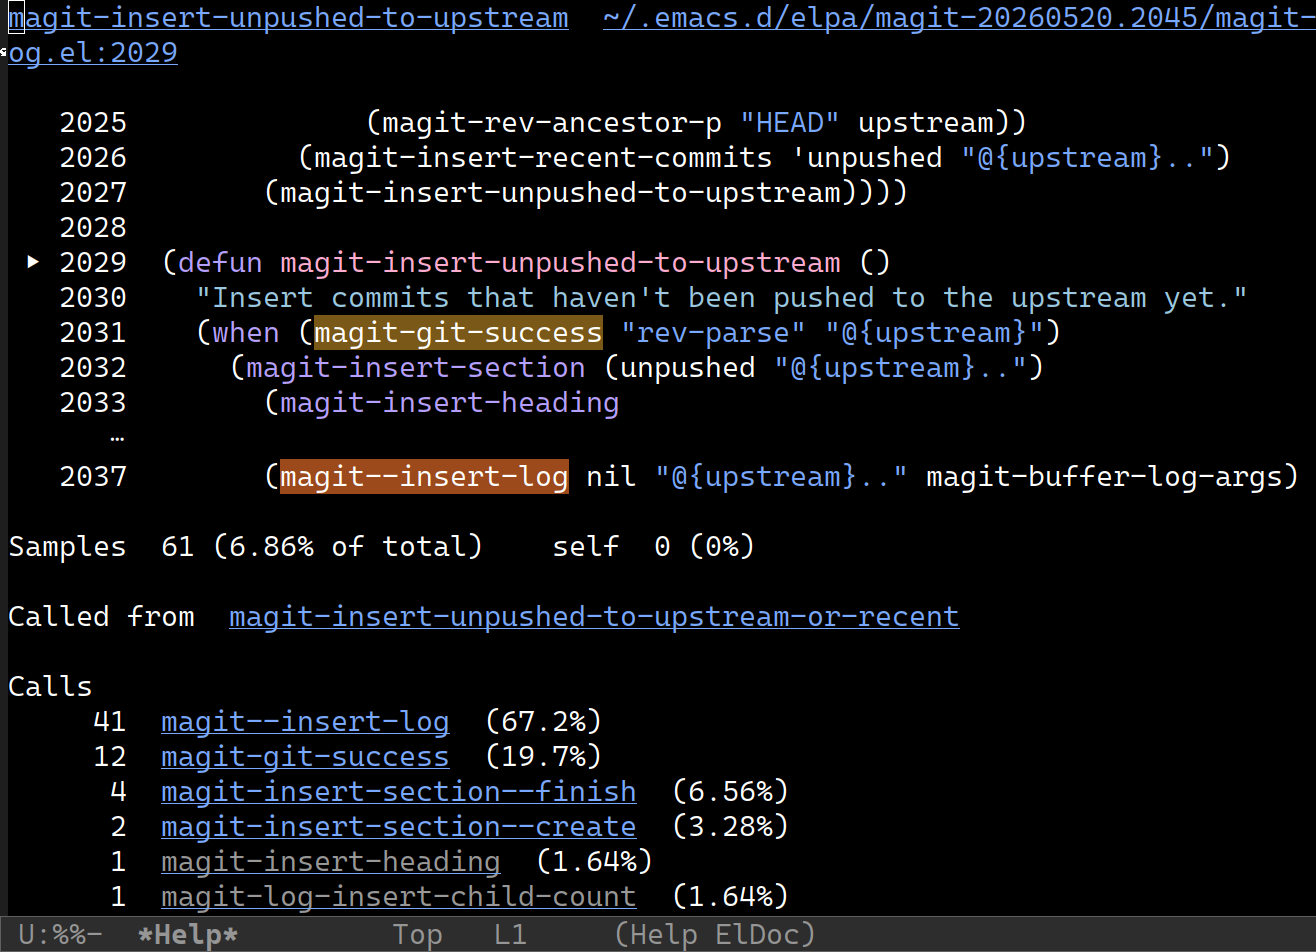
In the snippet, we try to pull in and highlight the source lines where
the frame's outgoing calls appear. Parent and callees are cross-references
(click to describe them); l / r walk the navigation history,
help-mode style.
For Emacs profiler data, those source matches may also add structure to the Calls tree. Folded-stacks profiles use them only for snippet highlighting, and keep the Calls list flat.
Installation
Until this lands on a package archive, clone the repo and add it to
your load-path:
(add-to-list 'load-path "/path/to/emacs-flamegraph")
(autoload 'flamegraph-profiler-report "flamegraph" nil t)
(autoload 'flamegraph-find-profile    "flamegraph" nil t)
Requires Emacs 30.1+.
Quick start
From a live profile
M-x profiler-start RET cpu RET     ; or `cpu+mem'
…run the code you want to measure…
M-x flamegraph-profiler-report
From a saved profile or folded-stacks file
M-x flamegraph-find-profile RET path/to/profile-or-stacks RET
Auto-detects between a profile saved with profiler-report-write-profile
and a "folded stacks" file. The latter is a common interchange format
(one ;-separated stack per line, followed by the sample count).
Key bindings (in the *Flamegraph* buffer)
| Key | Action |
|---|---|
RET, mouse-1 |
Zoom into the frame at point (make it the new root) |
u |
Zoom out one level |
t |
Reset zoom to the full graph |
l / r |
Go back / forward through the zoom history |
n, TAB |
Next frame |
p, S-TAB |
Previous frame |
d |
Describe the frame at point (samples, parent, callees, source) |
mouse-2 |
Describe the clicked frame |
f |
Visit the frame's source (definition or executing line) |
g |
Redraw (e.g. after resizing the window) |
q |
Quit |
Recording profile data
Emacs's native profiler
Just M-x profiler-start / M-x flamegraph-profiler-report. Or save
with profiler-report-write-profile and view later with
flamegraph-find-profile.
perf (Linux)
Recording:
perf record -F 99 -g --call-graph fp -p <pid> -o out.perf.data -- sleep 30
Use frame-pointer unwinding (--call-graph fp) when possible — this
needs the binary built with -fno-omit-frame-pointer, otherwise many
samples come back as [unknown]. On a stock build, --call-graph dwarf,N
also works and resolves most frames; the N-byte stack cap is its main
limitation.
If your app produces deep call stacks (Emacs easily does), raise the kernel's frame cap before recording:
sudo sysctl kernel.perf_event_max_stack=512 # default 127
Folding with source locations:
perf script --max-stack 512 --no-inline -F +srcline --full-source-path \
            -i out.perf.data \
  | perl stackcollapse-perf.pl --srcline \
  > out.folded
Pass -F +srcline so perf script emits source-line fields, and
--full-source-path so those fields use full paths. Source-line
resolution can be slow on deep-callchain profiles. Processing time may
improve with --no-inline if inline expansion is costly, at the cost of
omitting inlined frames.
For faster report generation without source locations, omit -F +srcline,
--full-source-path, and --srcline altogether.
py-spy, rbspy
py-spy record --format raw -o out.folded …
rbspy record --format collapsed --file out.folded …
Both commands write folded-stacks text (py-spy calls this raw,
rbspy calls it collapsed) with frames that include source line
slightly differenly; this package parses both.
For more profilers and recipes, see section 4 ("Instructions") of the canonical CPU Flame Graphs article.
Customization
| Variable | Purpose |
|---|---|
flamegraph-width |
Canvas width in columns (default: window width) |
flamegraph-frame-border |
Pixel gap between adjacent frame boxes |
flamegraph-text-padding |
Pixels between a frame's left edge and its label |
flamegraph-source-directory |
Where to resolve relative paths when visiting source |
flamegraph-call-site-threshold |
Min sample share for a callee to appear in the describe-buffer snippet (default: 2%) |
| Face | Purpose |
|---|---|
flamegraph-call-site-hot |
Highlight for the hottest callee occurrences in the describe-buffer snippet |
flamegraph-call-site-warm |
Highlight for moderately hot callee occurrences |
flamegraph-call-site-cool |
Highlight for minor callee occurrences |
Development
make check byte-compiles (warnings → errors) and runs the ERT suite;
EMACS=/path/to/emacs make check pins a particular build. CI runs it
on Emacs 30.1 and snapshot.
New ERT tests are welcome; they live under test/.
License
GPL-3.0-or-later.